Note: This is a crosspost of a Cynthion update on Crowd Supply: https://www.crowdsupply.com/great-scott-gadgets/cynthion/updates/cynthion-design-work-completed
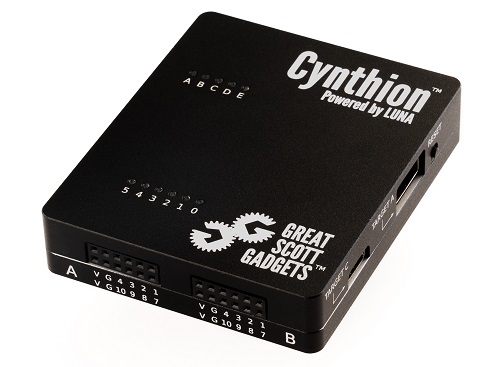
We are happy to say that early this month we completed the design work for Cynthion! This milestone is the culmination of yet another three months’ worth of work. Since our October update we have:
-
revisited the EMC testing lab for another round of pre-compliance testing,
-
used the EMC testing results to improve signal integrity on Cynthion and produce another hardware revision,
-
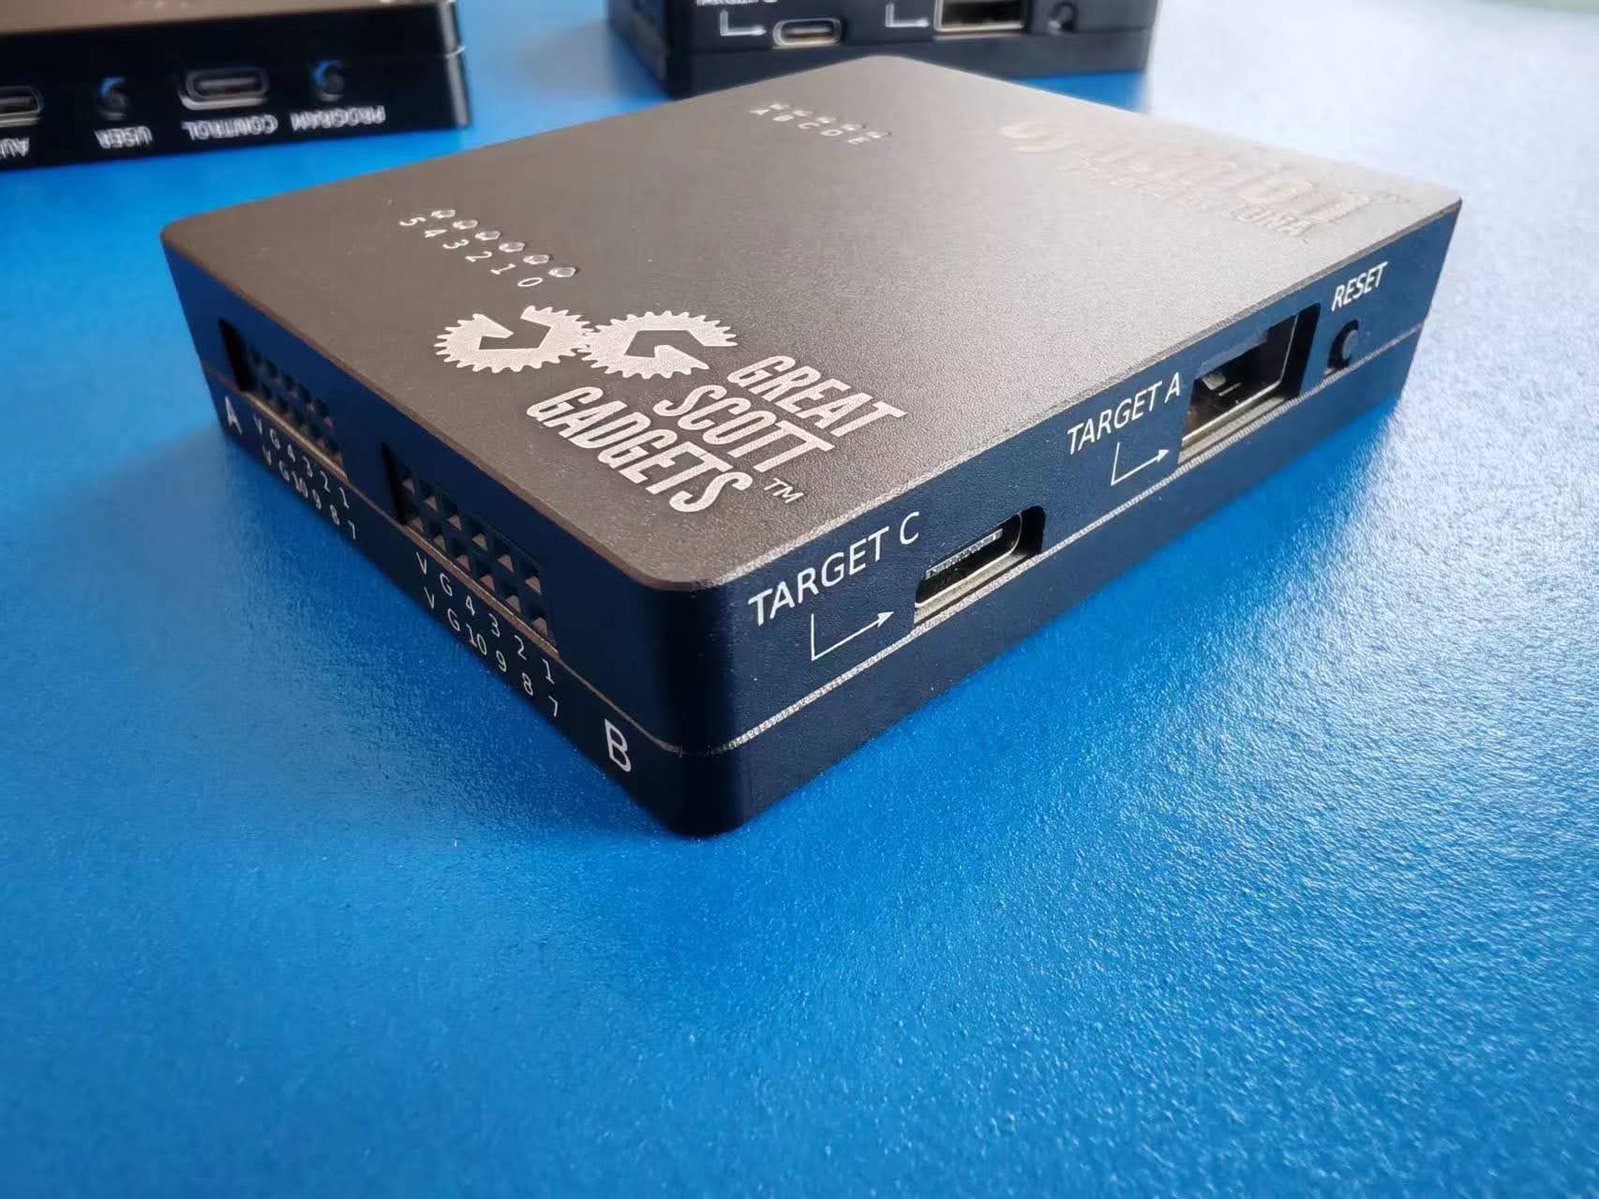
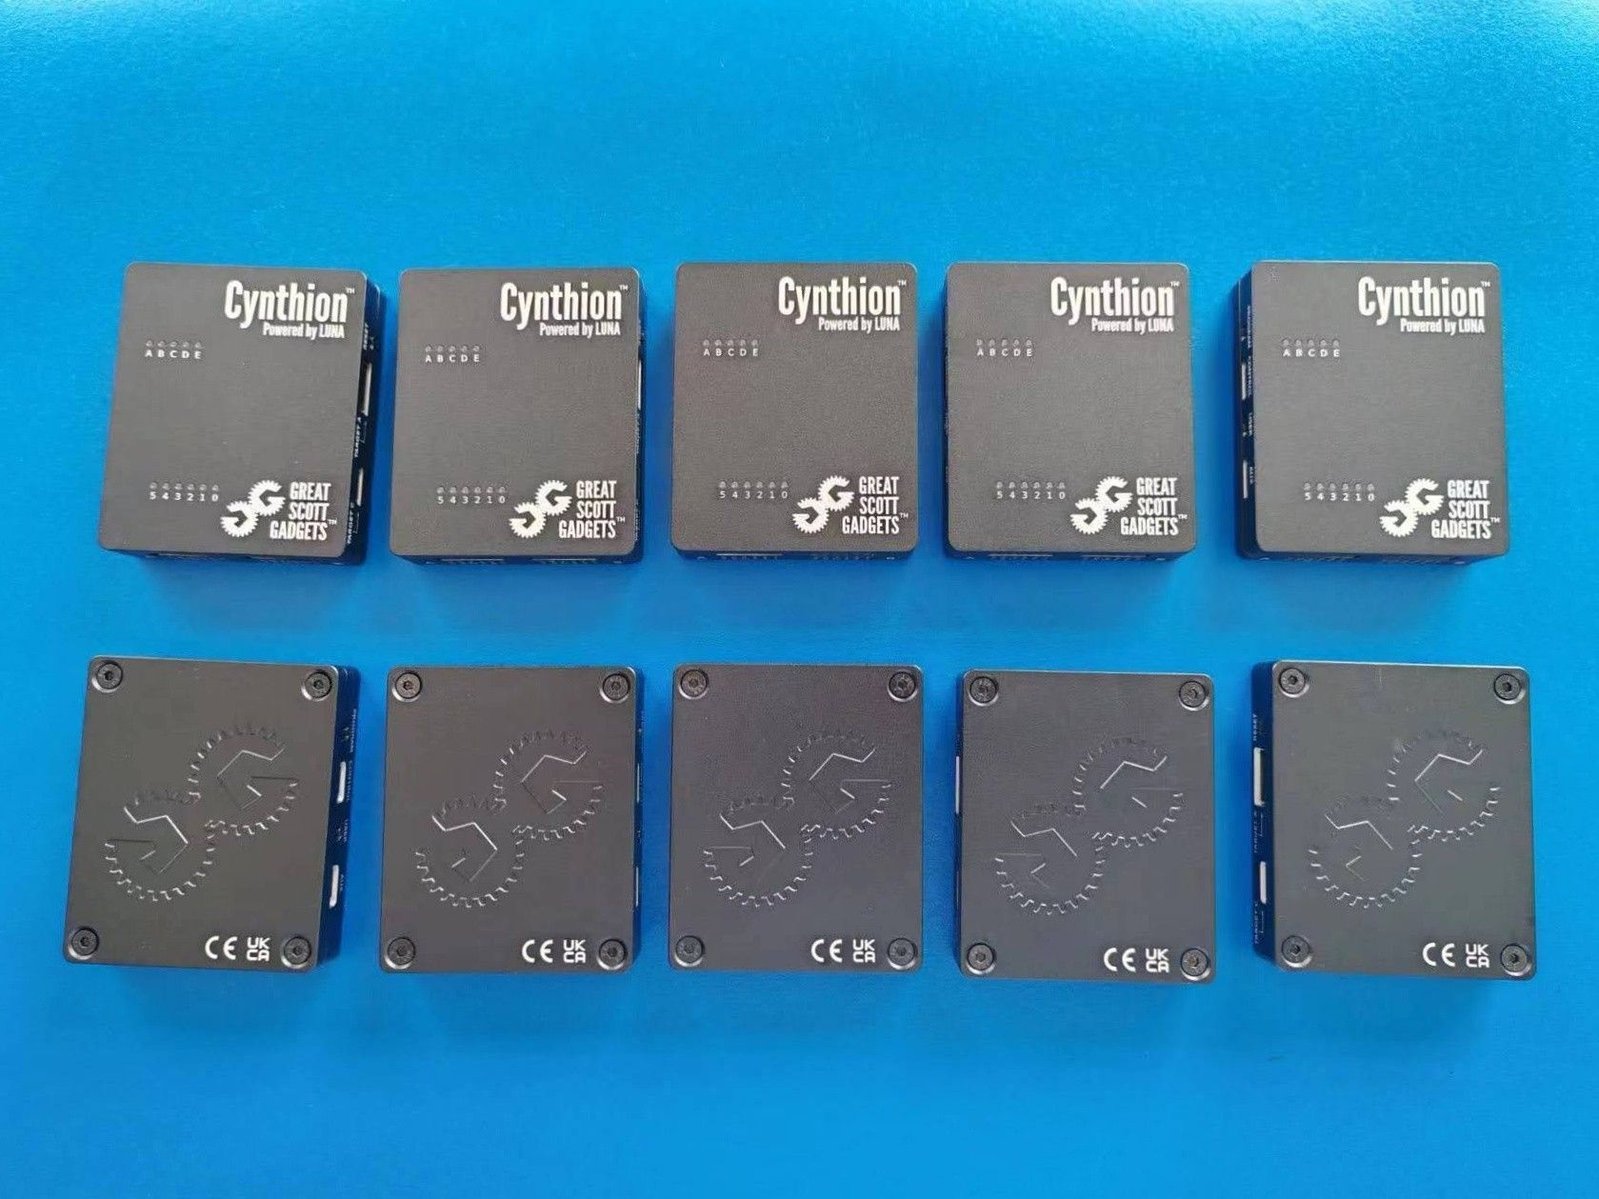
ordered another revision of the Cynthion enclosure prototypes,
-
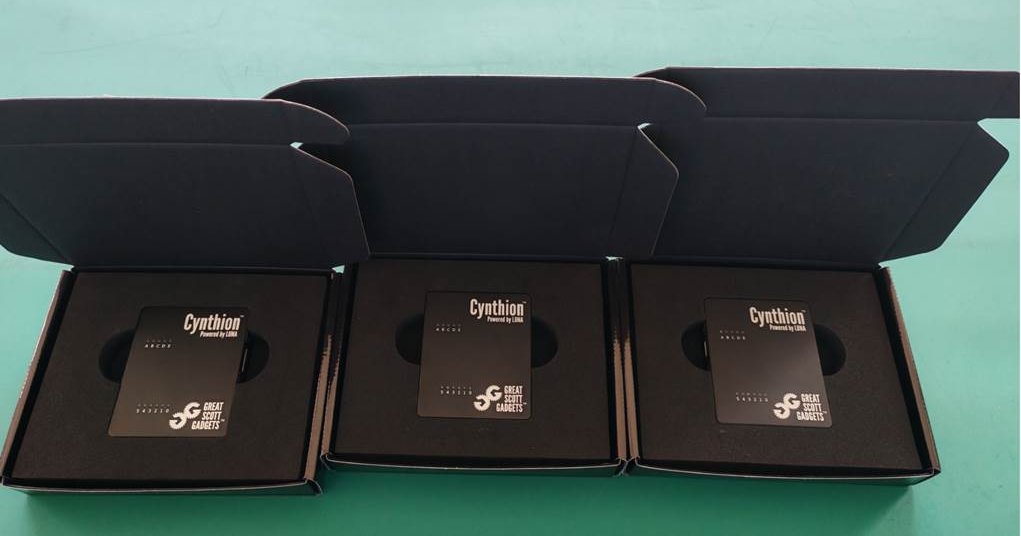
designed and ordered prototypes of the Cynthion packaging,
-
produced another Cynthion hardware revision to fix minor issues,
-
rearranged the Cynthion schematic,
-
updated documentation in Cynthion-related repositories,
-
ordered a production sample of Cynthion,
-
worked on the Cynthion manufacturing test jig and test scripts,
-
worked on apollo, luna, saturn-v, packetry, and Facedancer (all of which are used in conjunction with Cynthion or as part of manufacturing testing), and
-
scheduled another visit to the EMC testing lab for this week and taken Cynthion in for final evaluation.
Since we’ve only recently reached the milestone of finishing the design work, it means Cynthion delivery will be delayed until June to allow time for manufacturing and shipping. Here is what the current timeline to delivery looks like:
January
Since the completion of Cynthion’s design, we have pivoted to finishing up the hardware test jig (which we have named Tycho) that we will send to our manufacturer so they can test each Cynthion as it comes off the production line. Designing this test jig has required multiple revisions that have changed slightly with each revision of Cynthion. Since Cynthion is so unique in its design we have even had to develop custom cables for Tycho. This is a story we are looking forward to telling you all about once the Tycho team has completed their work.
February
Our manufacturer is based in China and they will be unavailable almost all of February due to Chinese New Year celebrations. We will spend this month continuing to work on Tycho, documentation for Cynthion and related projects, and improving software, firmware, and gateware. By the end of this month we will ship Tycho to our manufacturers.
March
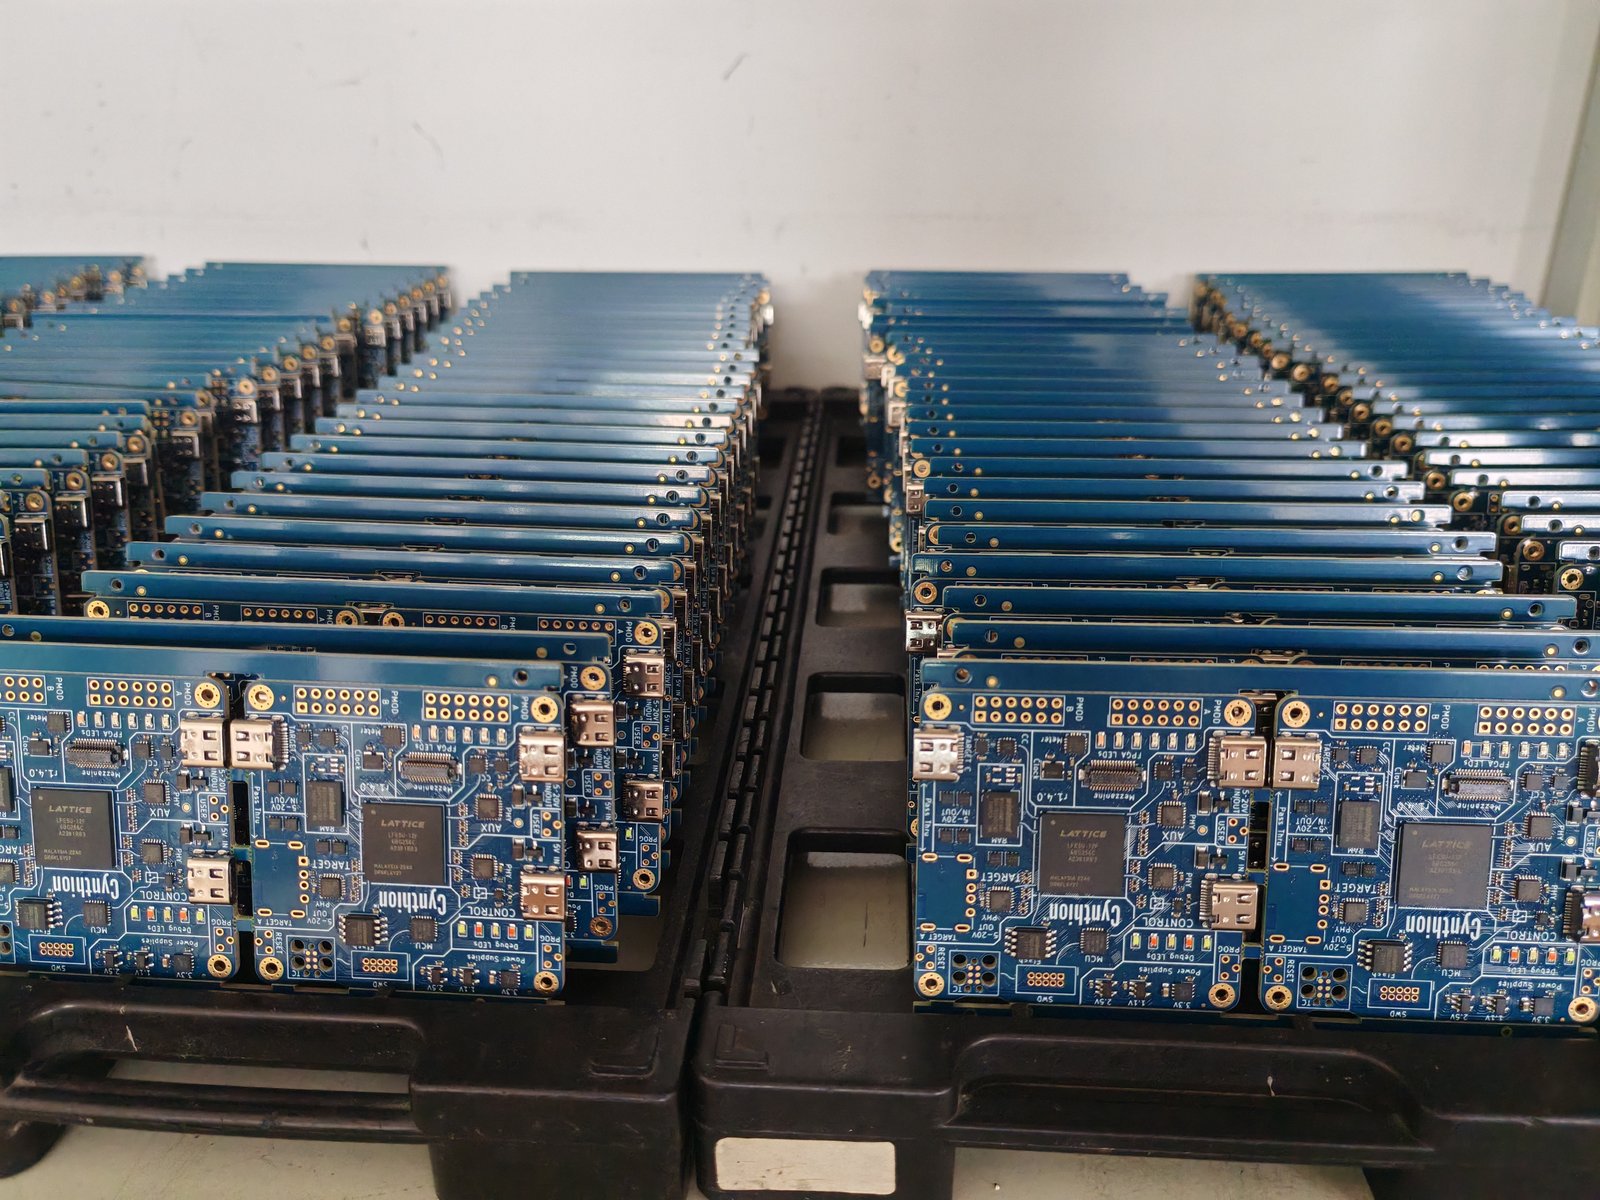
Cynthion will be in manufacturing for month one of two. In this month our manufacturers will produce the Cynthion PCBs, enclosures, and packaging. PCB production is expected to take about 2-3 weeks. As soon as the PCBs are produced, we will get a few production samples from the manufacturer for extra verification and testing by our team at Great Scott Gadgets. During this month we at Great Scott Gadgets will continue working on all of the Cynthion-related repositories and documentation.
April
Cynthion will be in manufacturing for month two of two. In this month Cynthions will be assembled, tested, and packaged by our manufacturer. Like March, we at Great Scott Gadgets will continue working on all of the Cynthion-related repositories and documentation. Additionally we will provide technical support to the manufacturing test team.
May
Cynthions will be on their way from our manufacturer in China to Crowd Supply’s fulfillment partner (Mouser) in the United States. At minimum this is expected to take two weeks, but we have scheduled an entire month for shipping as there can be lengthy customs delays when shipping internationally. This means that if there are no customs delays you may get your Cynthion sooner! Wish us luck.
June
The moment you’ve been waiting for! Cynthions will be shipped to you! If you have moved, you’ll want to make sure that you’ve updated your address on Crowd Supply before this point. Don’t worry, we will post an update before June reminding you to update your address.
